

FMQ Cluster Benchmark
FMQ Benchmark
The following benchmark focuses on a single-node MQTT scenario and is used as a capacity reference before scaling to a cluster.
Test Background
As MQTT-based business systems grow, message communication performance becomes a key requirement. This benchmark evaluates a 4-core 8 GB single-node server running FMQ MQTT Broker and provides data for future capacity planning.
Test Environment
| Item | Description |
|---|---|
| MQTT server | One lightweight 4-core 8 GB server running FMQ MQTT Broker |
| Benchmark clients | Four lightweight 4-core 8 GB servers simulating large numbers of MQTT clients |
| Operating system | Use a tuned Linux system with optimized file descriptors and network buffers |
| Benchmark tool | emqtt_bench, used to control connection count, message rate, and message size |
Test Indicators
- Connection count: the number of clients a single MQTT node can carry.
- Concurrent connections: the upper bound of simultaneous client connections.
- Message send rate: messages sent by clients per unit time.
- Message receive rate: messages received and processed by the server per unit time.
- Message latency: time from client send to server acknowledgement.
- CPU usage and memory usage during benchmark runs.
Test Scenarios
Increasing Concurrent Connections
Start from 100 concurrent connections and increase by 500 each round until 5000. Keep each level stable for 10 minutes and collect metrics. Distribute connections across the four benchmark clients to keep load balanced.
Fixed Connections With Increasing Message Rate
Set connection counts to 1000, 2000, 3000, 4000, and 5000. Under each connection level, start at 100 messages per second and increase gradually until clear bottlenecks appear, such as sharp latency growth or message loss.
Benchmark Data
The original benchmark indicates that with limited server resources, the actual connection count can exceed 300,000.
Connection Test
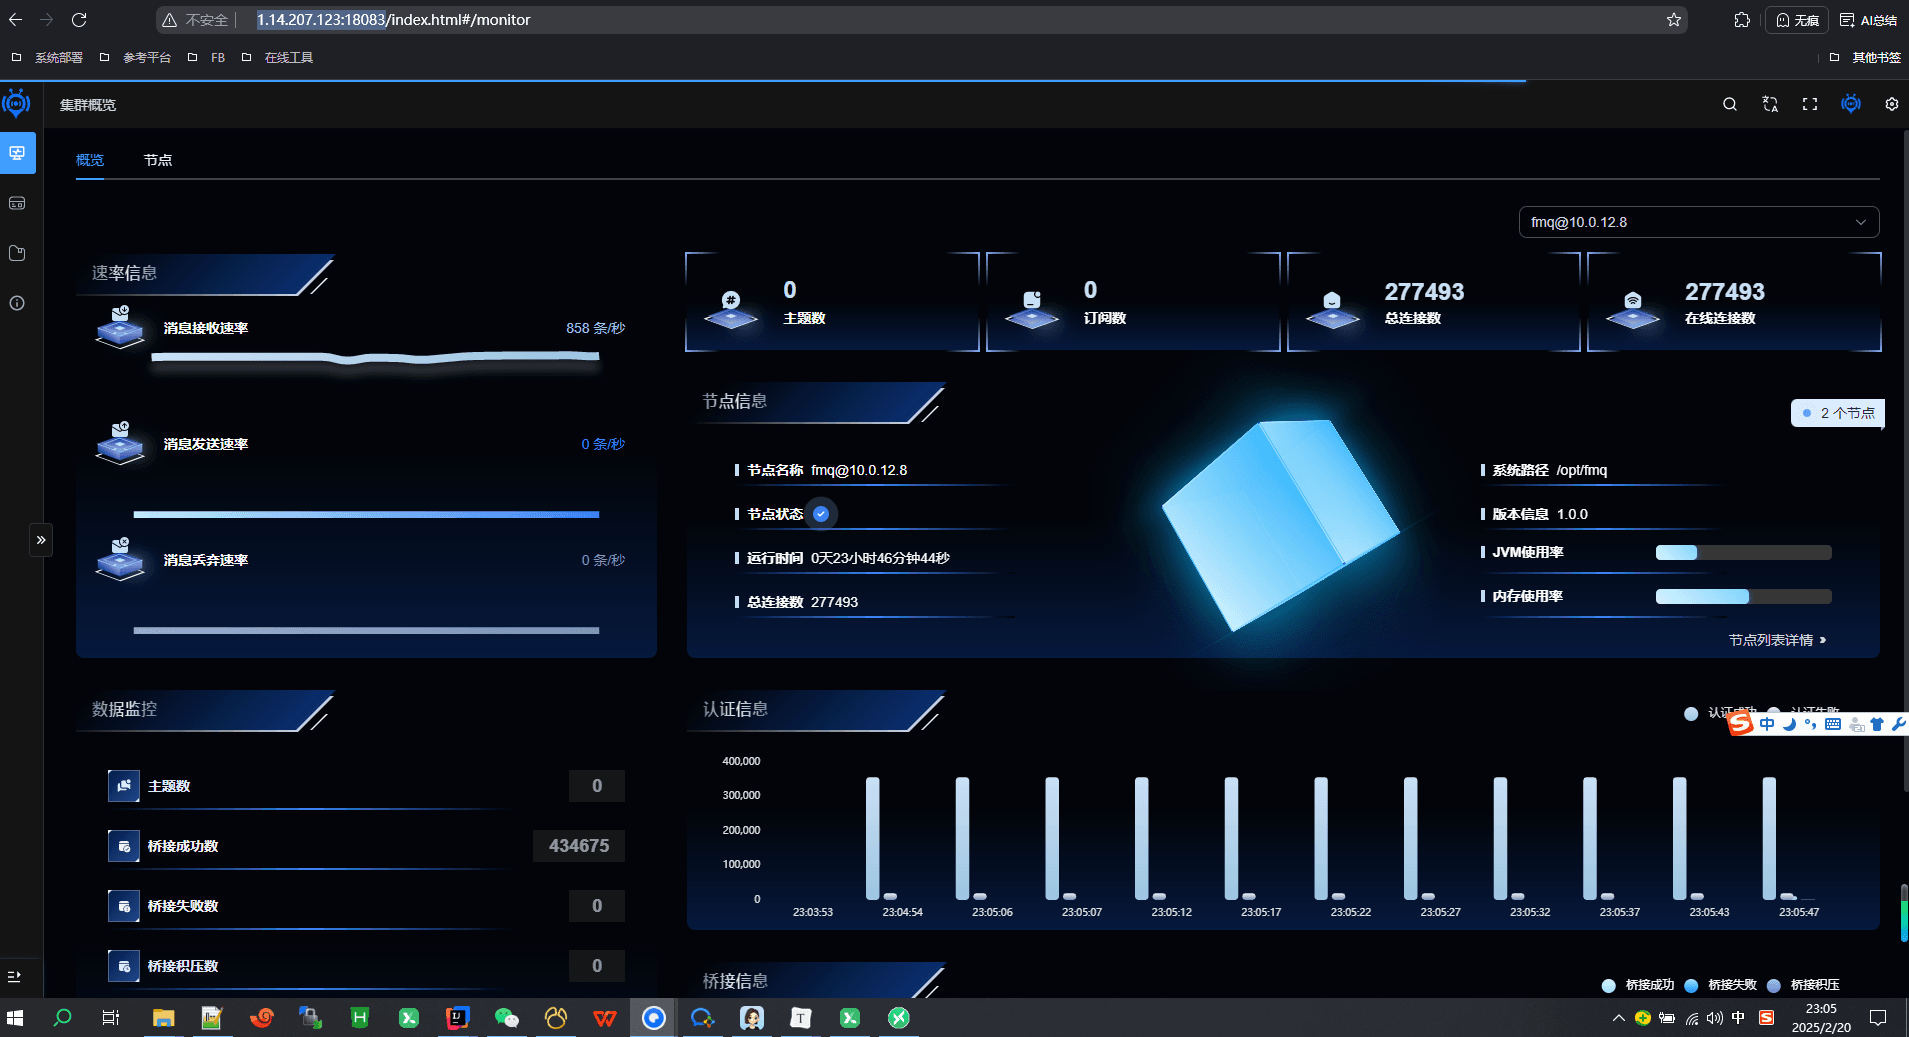
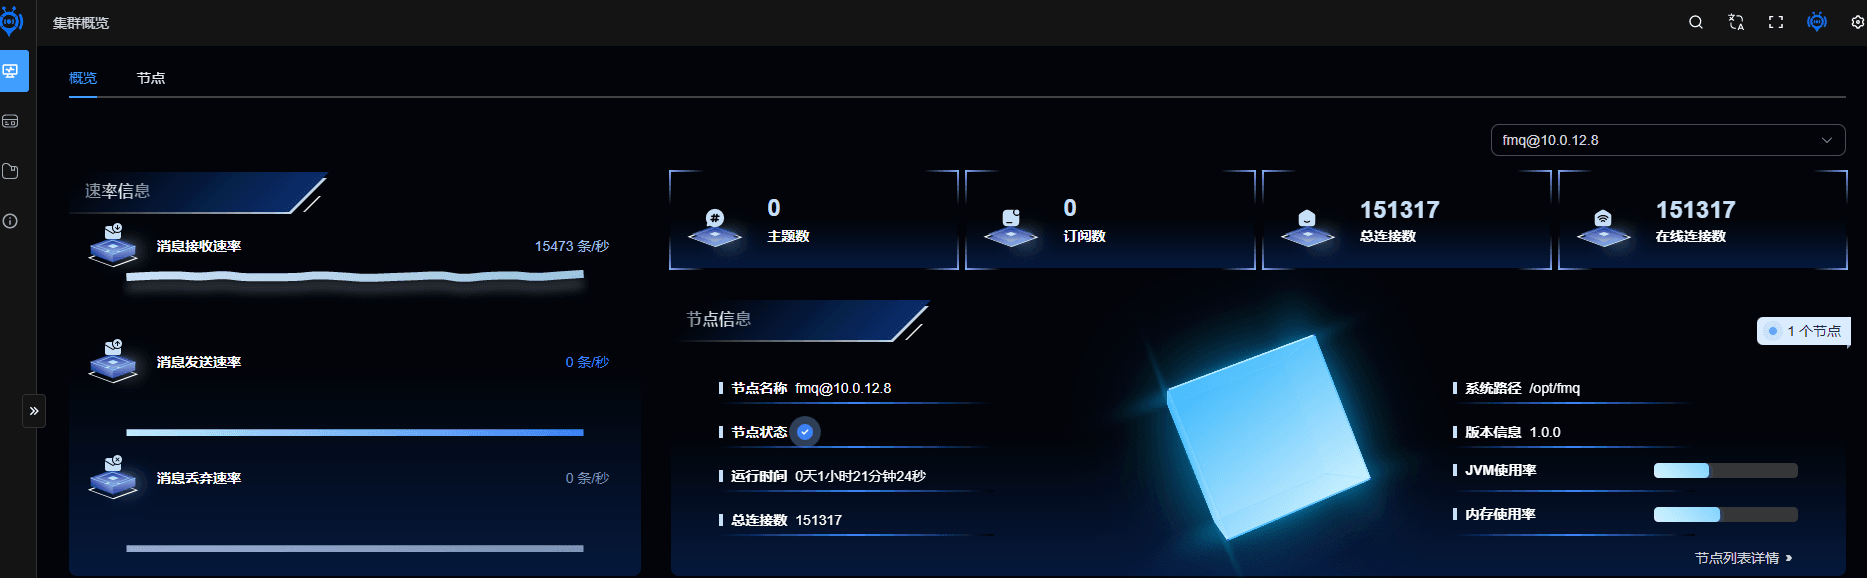
Memory usage:

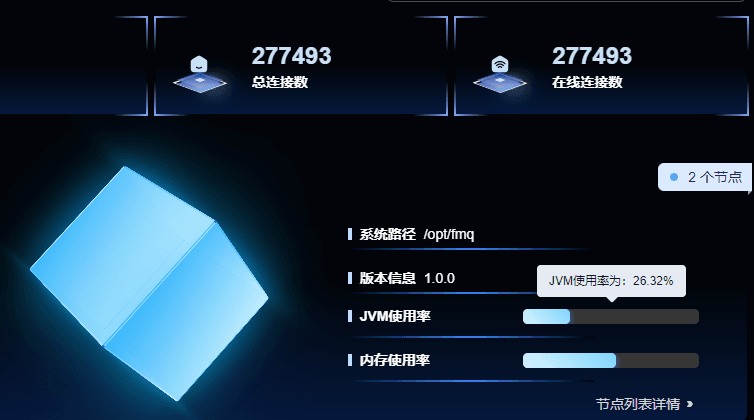
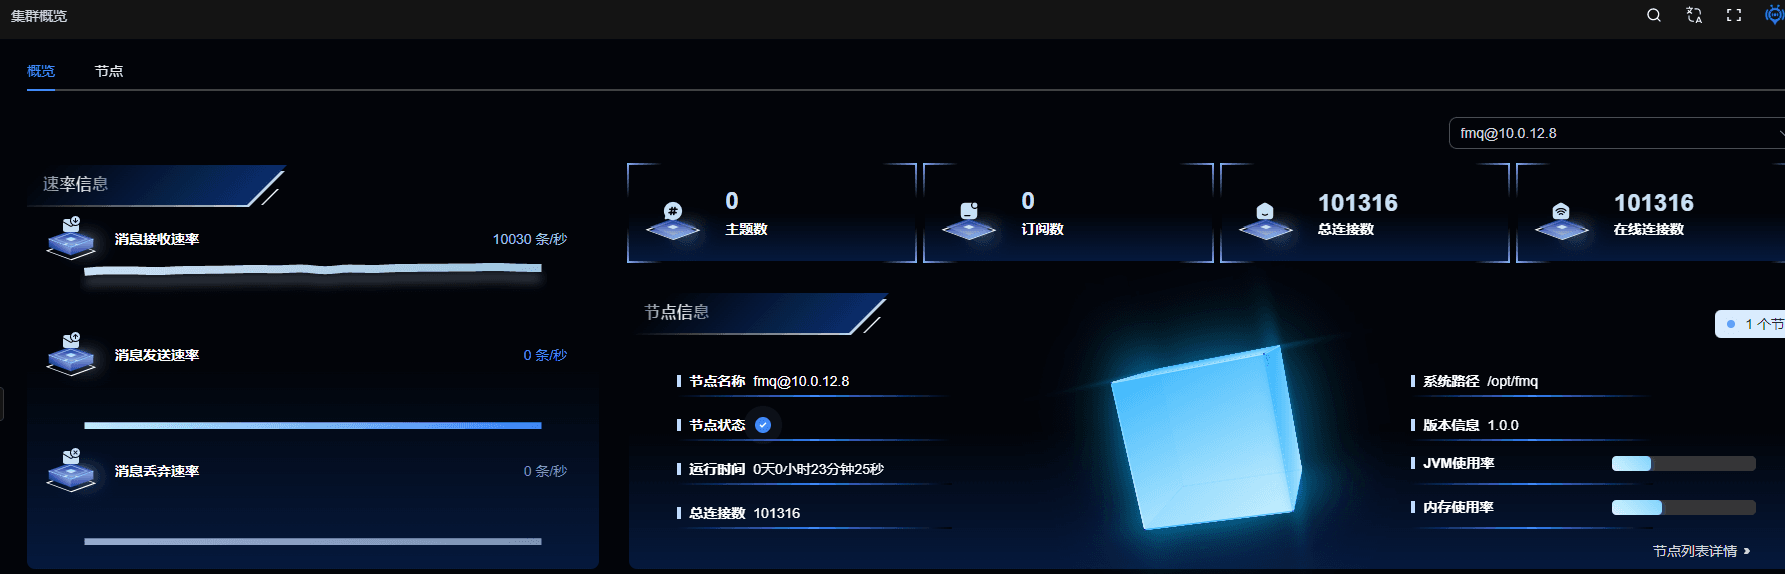
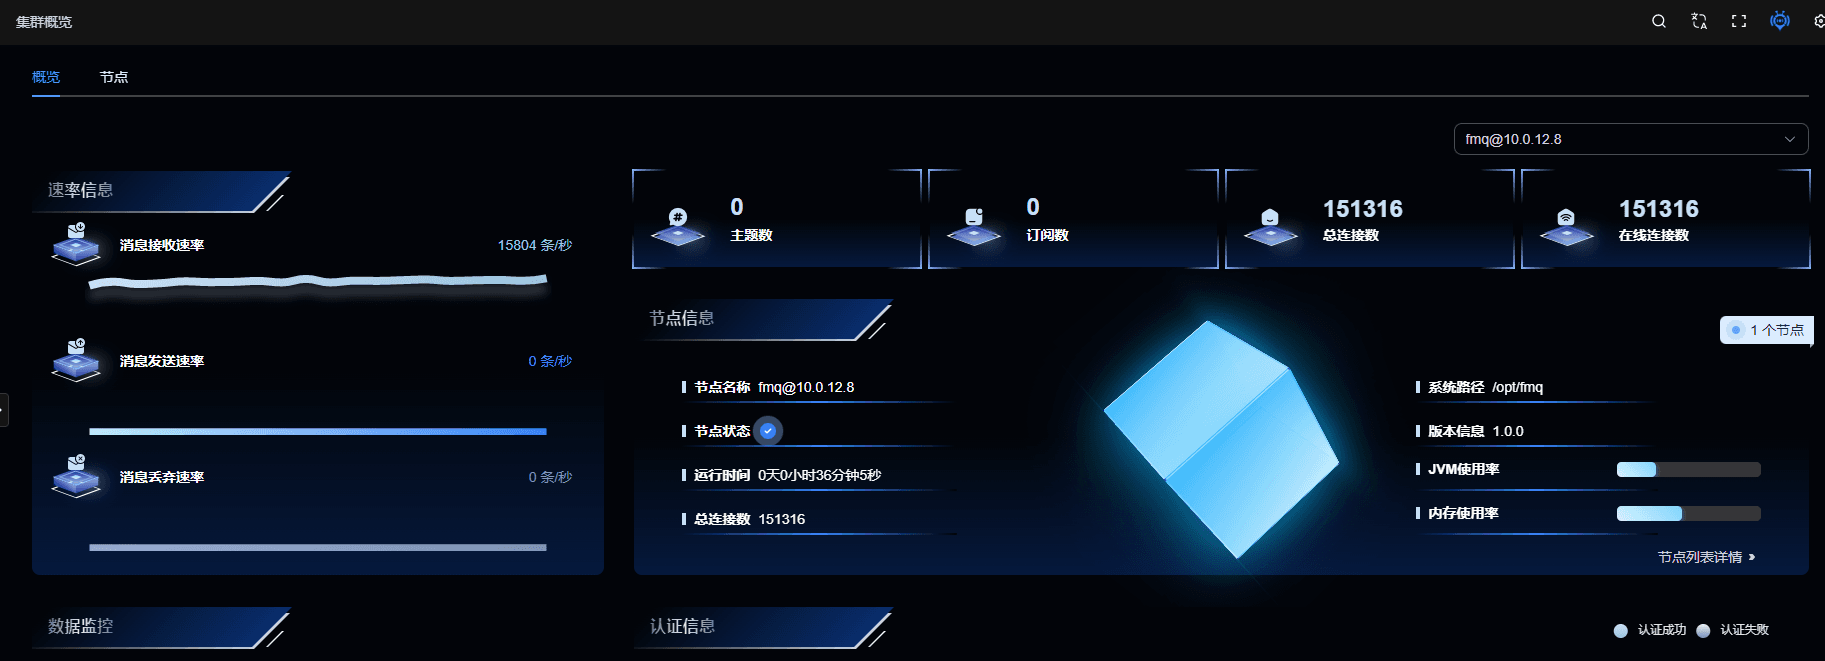
JVM usage:
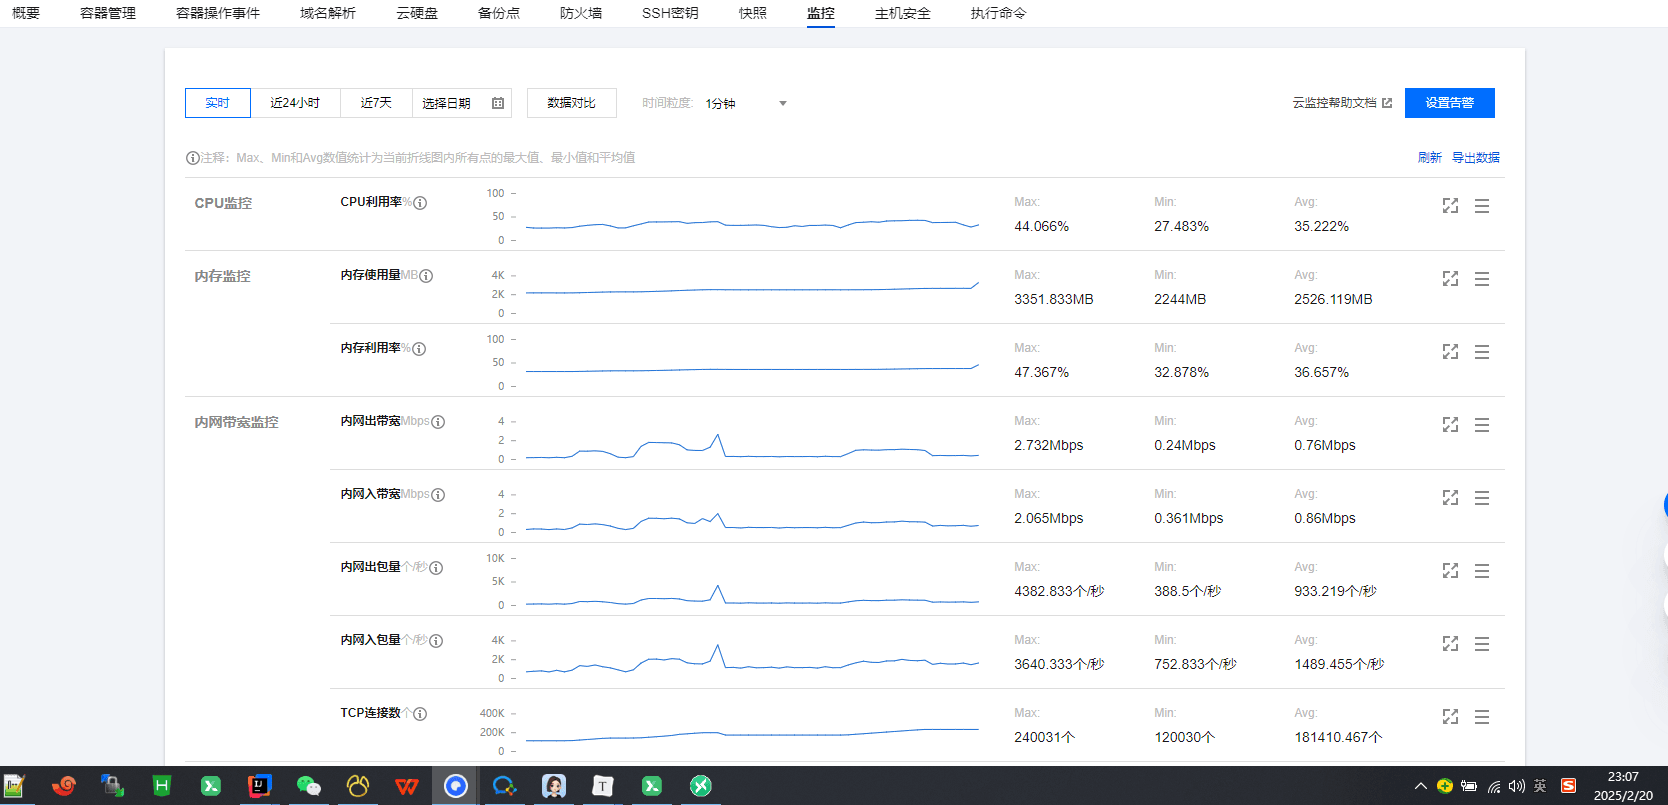
Server runtime:
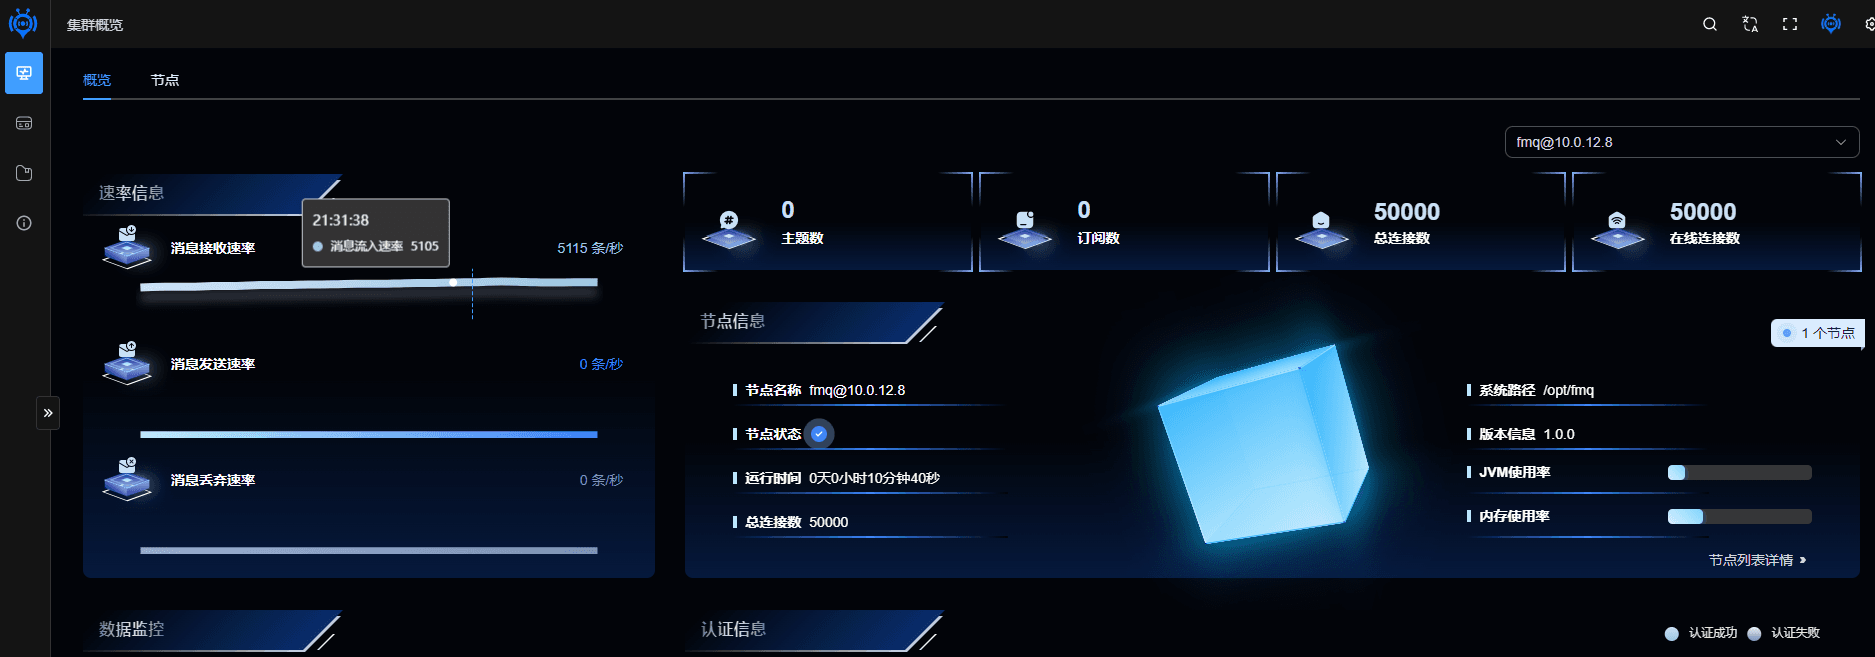
50k TPS
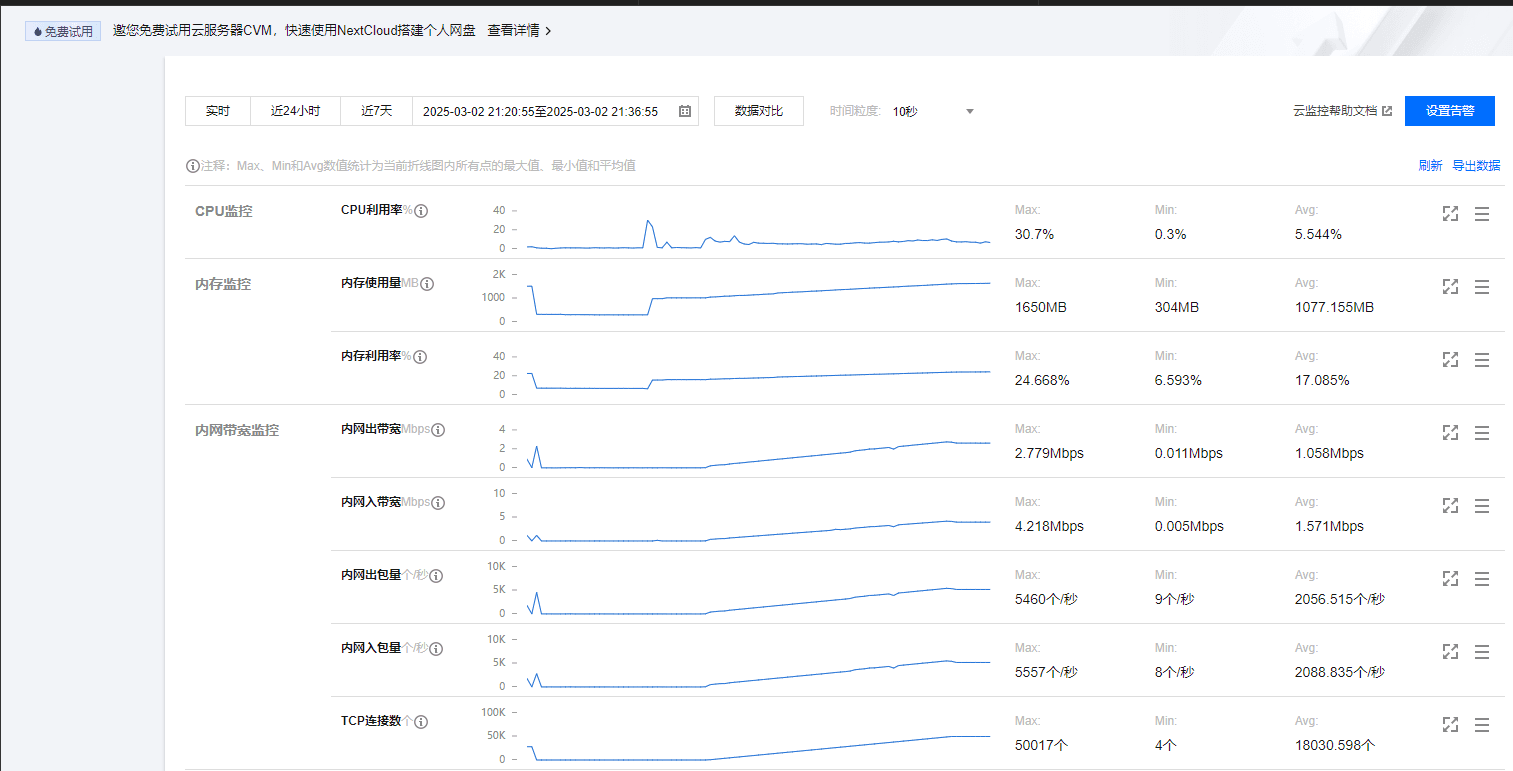
100k TPS
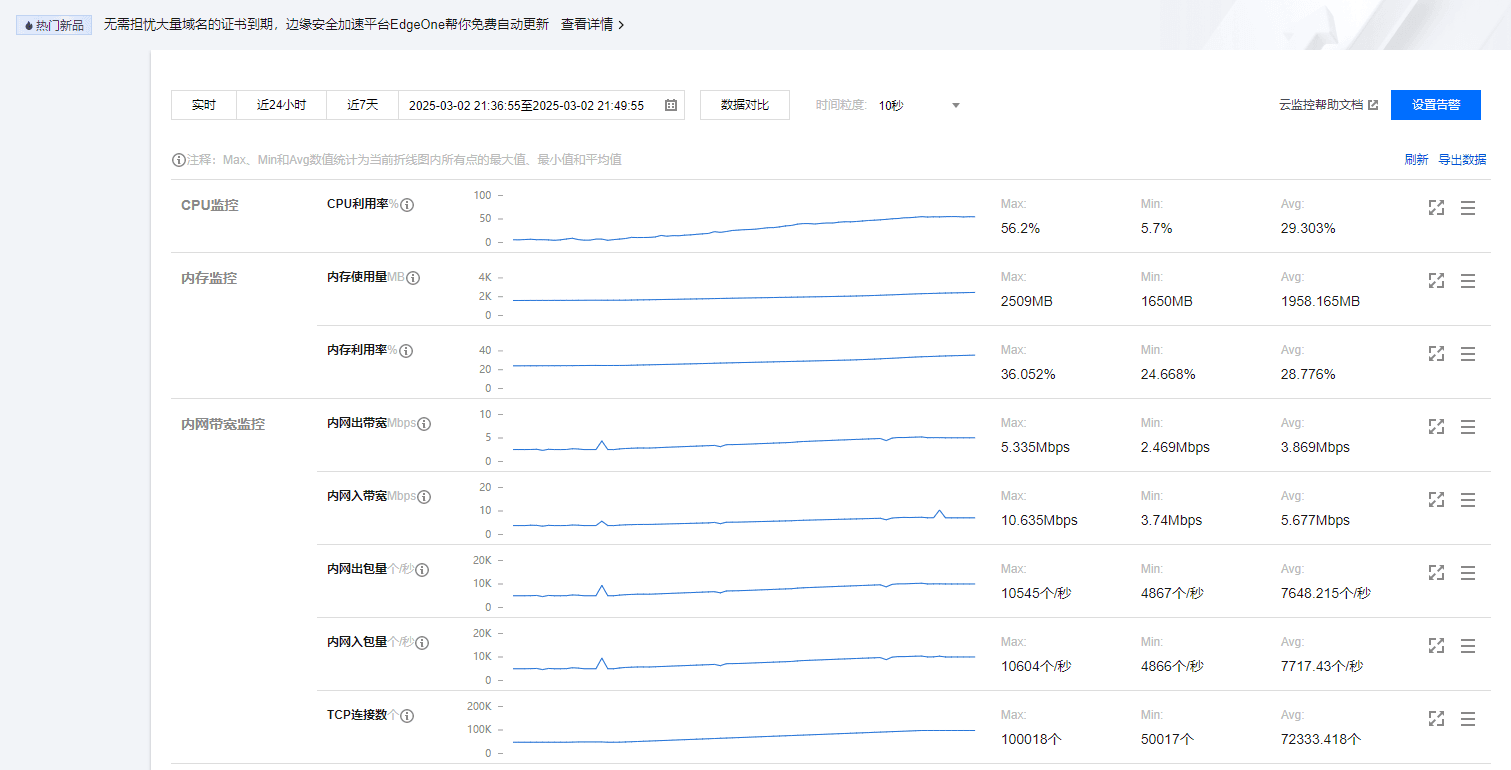
150k TPS
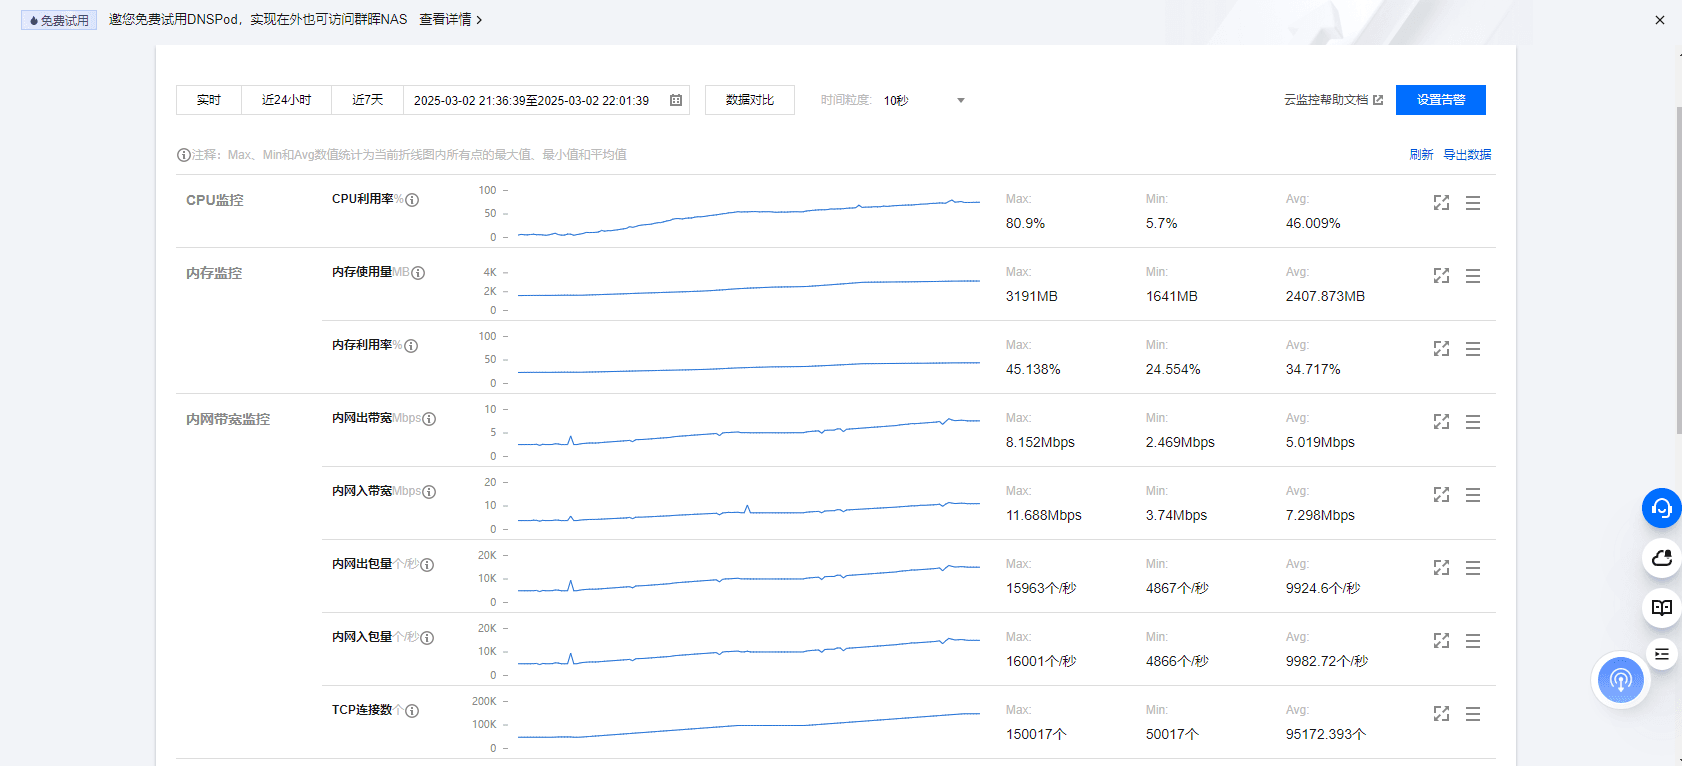
After Running For More Than One Hour
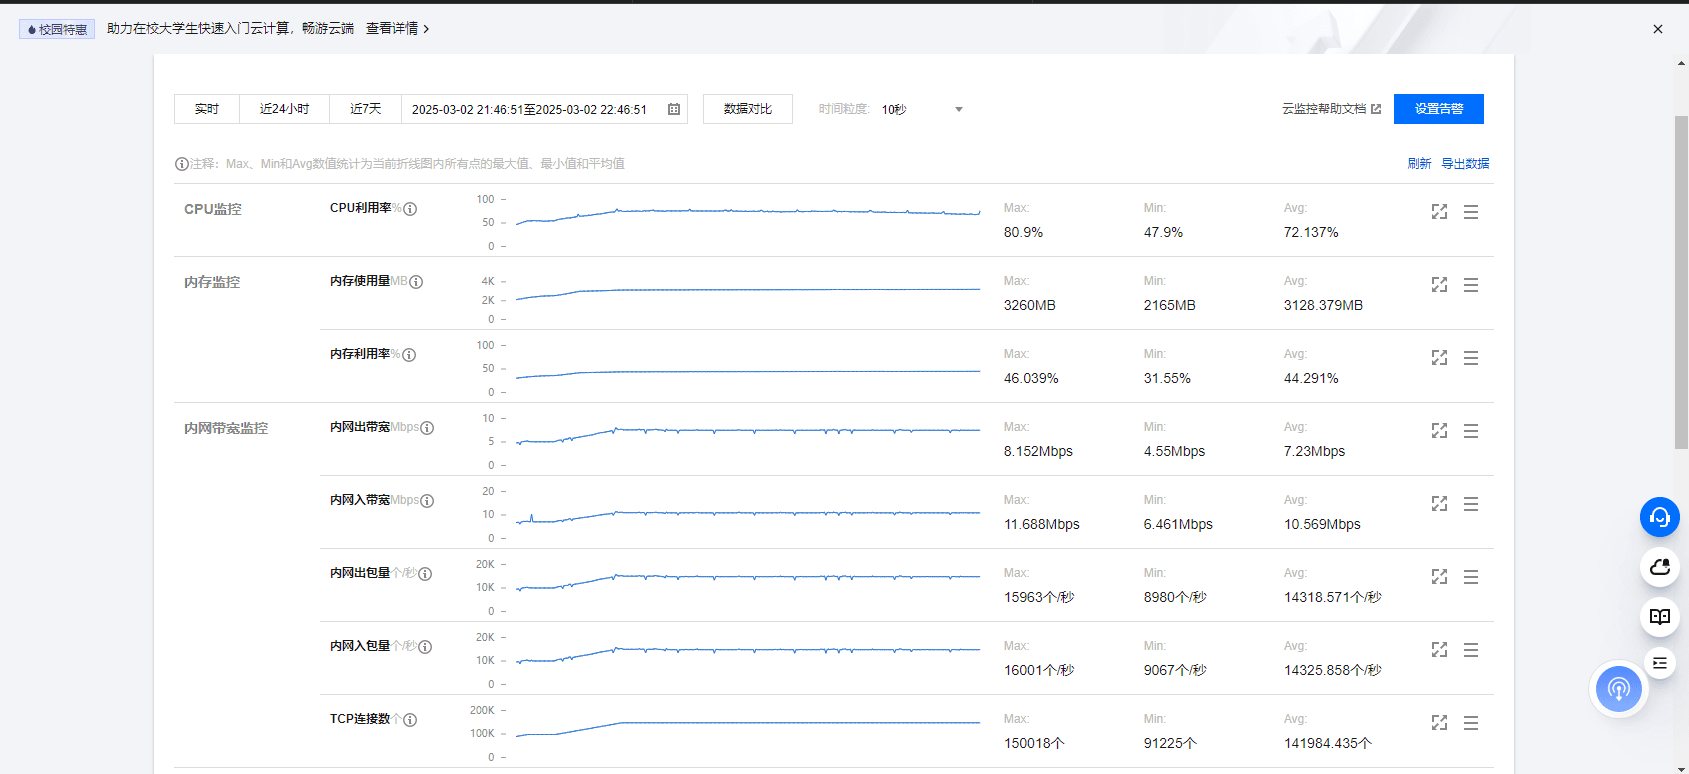
The benchmark uses 10-byte messages to simulate lightweight business messages and focuses on QoS 0, which is common in high-throughput scenarios.