


Charts, Layout, and Interaction
Use components to build the display, layers to organize its contents, and page settings to control dimensions and scaling. Inspect the existing Smart Street Lighting layout before arranging charts in your own project.
1. Before You Start
| Item | Details |
|---|---|
| Entry point | Visualization → Dashboard Management → Dashboard Projects → Edit |
| Permissions | Access the designer. Make changes in your own project. |
| What to check | Screen dimensions, key metrics, and what the viewer should see first |
2. From Canvas to Layers
- Check width, height, background, fit mode, and theme in Page Settings. Smart Street Lighting uses 1920 × 1080. Set your project's size for the target display.
- Choose a suitable chart from Components: for example, a line chart for trends or a bar chart for category comparisons. Information, lists, and images provide supporting context.
- In Layers, group content by purpose, such as Key Metrics, Lighting Power Trend, or Recent Streetlight Faults. Give layers meaningful names and check that their stacking order does not hide important values.
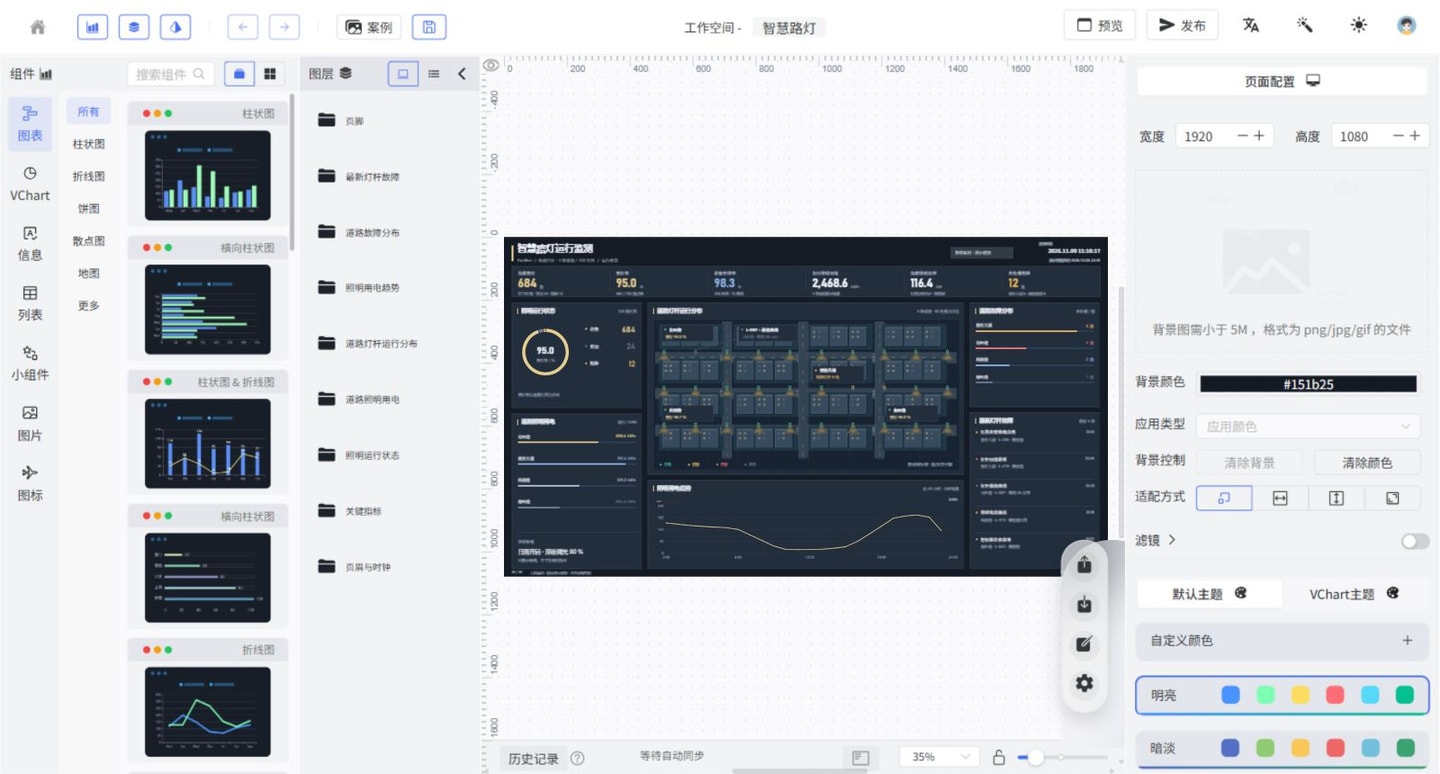
Follow the screenshot: Find Lighting Power Trend in Layers and check that you selected the chart or its group rather than a similar-looking background. To adjust the page, click an empty area to return to Page Settings on the right and check the dimensions and fit mode. To change a chart, select the specific component and inspect its available settings. The editor view scale shown is not the published view's dimensions.
3. Editor Tools and Component Settings
| Area or action | Details |
|---|---|
| Components | Choose from categories such as charts, information, lists, and images. Drag a component onto the canvas, then configure it. |
| Layers | Find the components currently in use, group them by business area, and manage their stacking order so decorative images do not cover data or controls. |
| Workspace | Identify the current project and distinguish dashboards with different themes. |
| Page Settings | Click a blank area of the canvas to set dimensions, background, colors, and fit mode. |
| Component Settings | Select a specific component to check its style, data, animations, and events. Available settings vary by component. |
| Save, Preview, and Publish | Retain edits, check the display, and deliver access, respectively. These are not the same state. |
Choose charts according to the question they need to answer: a metric card for a single value, a line chart for change over time, a bar chart for category comparisons, and a list for operational events. Make titles, units, and metric definitions clear before adding decoration and animation.
4. Configure Component Linkage
Component interaction passes data from a source component as query parameters to another chart. For example, selecting an area can restrict device statistics to that area, or changing a time range can refresh a trend chart.
- Configure the chart that receives the parameters first. Confirm that its dynamic request or shared API returns the correct results for the given parameters.
- Define stable names and default values in the target request's existing
ParamsorHeaderfields, such as an area identifier and start and end times. Field names must match the API requirements. Current component interaction does not mapBody; do not apply request-body configuration directly to this step. - In the interaction settings of a source component, such as a dropdown or date selector, choose the trigger action and target chart, then map the selected values to the target parameters. Only components that support interaction data output can serve this role.
- During preview, check whether request parameters change first, then inspect the response and chart. If there are multiple targets, check that each chart receives the correct fields. Avoid updating only a title without running the query again.
- Test the default conditions, filtered results, and cleared conditions separately. Confirm that clearing the filters restores the agreed default range instead of retaining previous values.
If event code is needed, limit it to display behavior on the current page, guard against null values, and avoid triggering duplicate requests. Changes to shared request parameters may affect multiple charts, so establish the scope before configuring them.
5. Check Charts and Interactions
- Preview at the target resolution. Look for clipped headings, legends, units, and text. Key metrics should be easier to spot than supporting information.
- For linked filters, identify the source component, target chart, and filter field. Use the available interaction settings to pass the selected value to the target query. Verify the default, filtered, and cleared results.
- See Data Sources and Queries to confirm that a change came from a request or an actual filter, rather than a color change or a demo layer. A static case validates the display layout, not live queries or linkage.