
Projects and Templates
Open dashboards from Dashboard Projects. Fixed Dashboard and Visualization Dashboard are separate viewing entries in the sidebar, not the project management list.
1. Before You Start
| Item | Details |
|---|---|
| Entry point | Visualization → Dashboard Management → Dashboard Projects |
| Permissions | Search and preview. Creating or editing requires the corresponding permission. |
| Reference case | Smart Street Lighting shows metrics, trends, distributions, and alerts. |
2. Find or Create a Project
- In Visualization Management, search by project name. Each card shows its name and publication status and offers Edit, Preview, and More.
- To explore the layout, preview Smart Street Lighting. Look at the lighting rate, online rate, power usage trend, and fault distribution. The case is labeled as fixed demo data and does not control streetlights.
- To build your own dashboard, choose New Project in the list, then set its page dimensions and components in the editor. Do not change the shared demo project directly.
3. Select a Template from the Case Library
- Open Cases in the dashboard editor toolbar. Browse by industry or project name, such as Smart Campus, Industrial Equipment Monitoring, or Cold Chain Warehouse.
- Check the case preview, resolution, and data label. To adopt it in a project you may edit, click Use Case, then check the layers, components, and page proportions.
- Use Data Sources and Queries to replace metrics that should be live. Clearly label any demo data you keep.
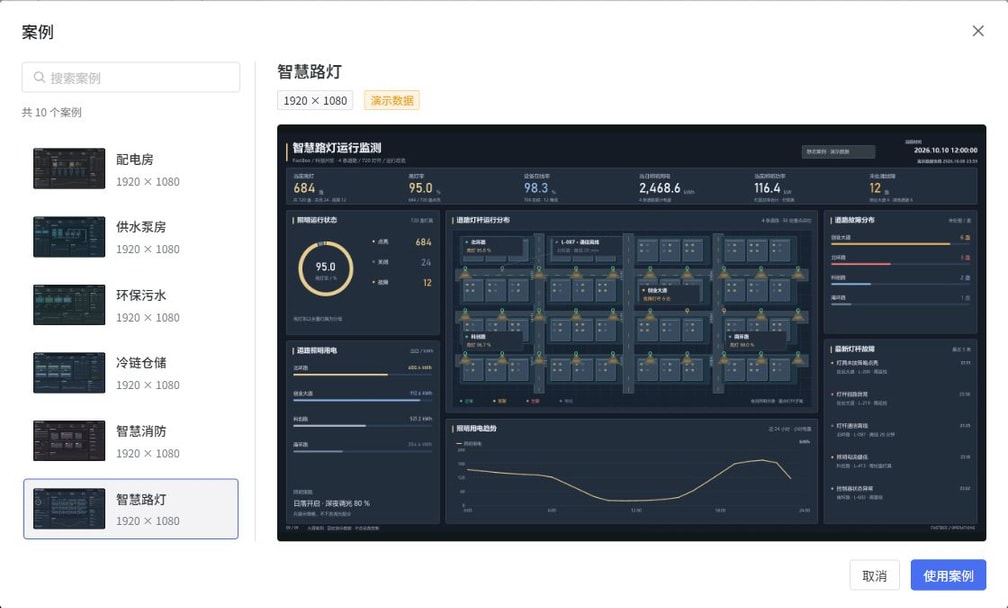
Follow the screenshot: Use Search Cases on the left to find a template. On the right, check its name, resolution, and Demo Data badge, then check whether the preview fits the intended display. Select Cancel when browsing only. To reuse a template, select Use Case in a project you are allowed to modify, then review the inherited metrics, data sources, and page dimensions.
4. Dashboard Building Workflow
Dashboards use a graphical interface and drag-and-drop components to turn complex data into charts, metrics, and maps of business distributions. They suit display scenarios such as smart cities, campuses, security, and monitoring stations. Start with a blank project, or use a case first and then replace its metrics and data sources with your own.
- Define the theme, target screen dimensions, and metric definitions, such as device count, online rate, daily power usage, and pending alerts.
- Create a project and set a recognizable project name using the workspace name at the top of the editor.
- Set page dimensions, background, and fit mode. Drag components onto the canvas and organize layers by business area.
- Complete the chart layout with static samples first, then configure dynamic requests or shared APIs and handle any differences between the response format and component requirements.
- If linked filters are needed, configure how interaction components pass parameters to the target charts.
- Save manually and preview. Once the display and data are correct, publish and test the delivery entry as the intended viewer.
Content remaining visible in the editor does not mean it has been saved, and fixed demo values in a case do not mean your devices are connected. Before modifying a shared case, reuse it in your own project that you are allowed to edit.
5. Distinguish Management and Viewing Entries
| Entry | Purpose |
|---|---|
| Dashboard Projects | Search, create, edit, and preview projects, and maintain their publication status. This is the main entry for the operations in this chapter. |
| Fixed Dashboard | Open an existing fixed display page, not manage drag-and-drop projects. |
| Visualization Dashboard | Open a configured dashboard display link. This is separate from the current project management list. |
Each deployment can configure its own display links. At delivery, confirm that the link belongs to the current environment rather than reusing a domain or project identifier from the example environment.