


Data Sources and Queries
Dashboard data configuration has two parts: get a correct response from the source, then map its fields to the chart. A successful response does not mean the component can use the data as-is.
1. Before You Start
| Item | Details |
|---|---|
| Entry point | Visualization → Dashboard Management → Data Access. For component settings, go to Dashboard Projects → Edit. |
| Permissions | View the target device, properties, and data. Configuring requests requires project edit permission. |
| What to check | Metric units, time range, handling of missing values, and the field structure the component expects |
2. Prepare a Device Query in Data Access
- In Parameter Configuration, select a chart type under Select Component Type.
- Under Select Device and Data Item, select the device first and then its property. The property selector is unavailable until a device is selected.
- Click Generate and inspect the result in Response. Before using it in a component, verify that the URL points to the intended environment and the response contains the target property and a usable sample. Do not expose URLs containing credentials in documentation or public links.
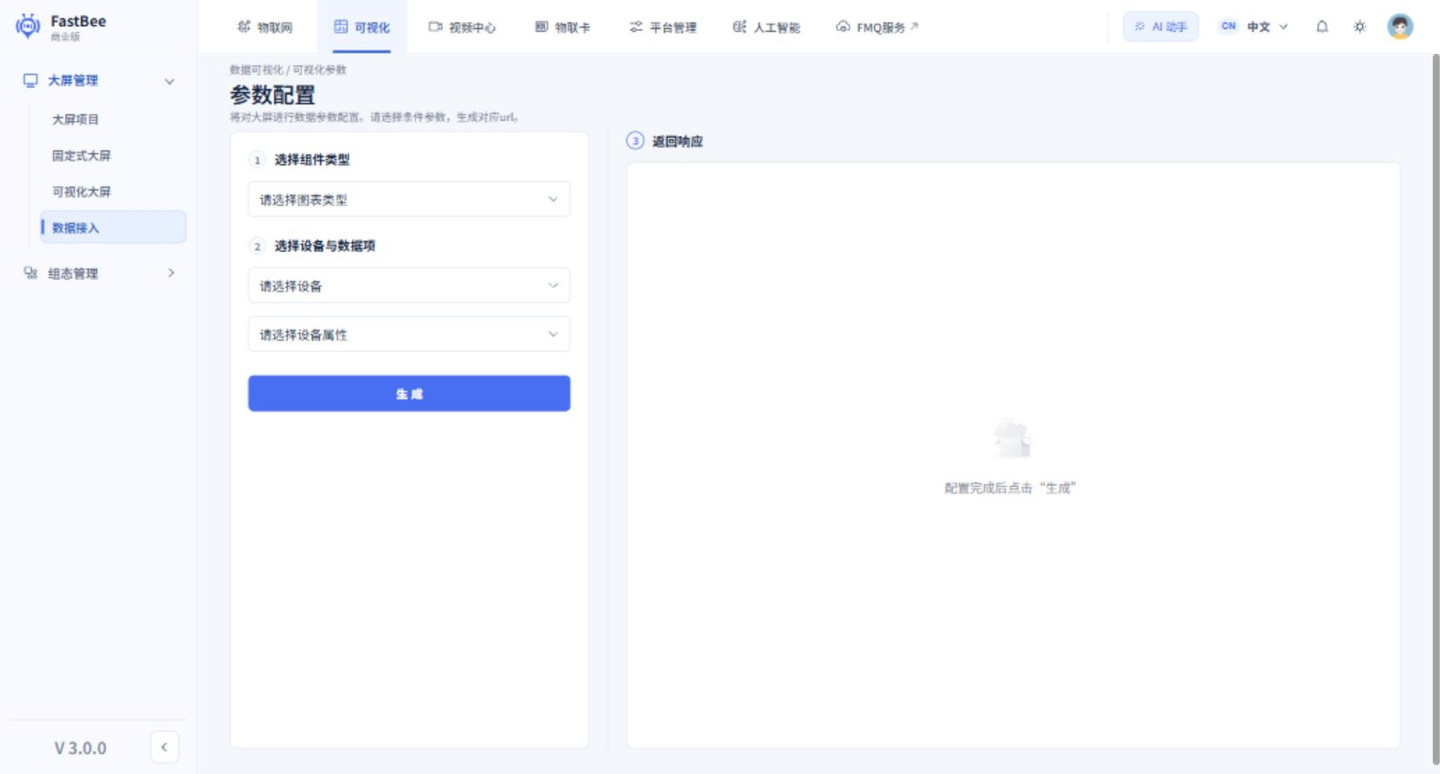
Example: a temperature trend. On the left, choose a component type suited to a trend, then select an authorized device and its actual temperature property before selecting Generate. A result should appear under Response on the right. Check for usable times and values before mapping them in the chart. If generation succeeds but the sample is empty, first check device data and the selected property. If the response has values but the chart is empty, inspect the component fields and the filtered result.
3. Verify Component Data Mapping
| Data mode | When to use it | What to check |
|---|---|---|
| Static data | Layout work, demos, or fixed content | Label sample data clearly and keep it distinct from live data. |
| Dynamic request | Actual device metrics or business statistics | Verify permissions, response shape, refresh frequency, and failure states. |
| Shared API | Several components reuse the same request configuration | Maintain a consistent request URL, headers, parameters, and metric definitions. Verify separately whether actual requests are combined. |
Start with one chart and a known sample. For trends, check the time field, value field, and unit. For category charts, check the category field, sorting, and each category's metric. If a successful response produces an empty chart, first check the expected data shape, then mappings, null values, and field types.
3.1. Static Data
Select a component and choose static data in its data settings. First inspect the data or sample provided for that component. Keep the field names and structure unchanged, replace the business values, and preview to check that the legend, categories, and values correspond. Static data suits layout work and demonstrations; it does not update automatically with device reports.
3.2. Dynamic Requests
- Select the component that needs data, choose dynamic requests in its data settings, and open the request configuration.
- Check the base URL, request method, and request path. If the API requires parameters, check
Params,Body, andHeadersseparately to ensure parameters are in the correct location. - Send one authorized read-only query first. Confirm that the response succeeds and contains the required fields before setting a refresh interval. Avoid overly frequent requests for a single live value that cause multiple components to continually overload the same API.
- Check the sign-in session, cross-origin policy, HTTP/HTTPS, and API permissions in the target access environment. A successful request in the designer does not mean the published page uses the same identity.
Other components may reuse the base URL or request headers, so check the scope of any change first. Do not put long-lived credentials or administrator tokens into project configurations that can be downloaded publicly.
3.3. Shared APIs
When multiple components need the same API, maintain the request under shared APIs first, then select it for reuse in other components. Managing the URL, headers, and parameters centrally reduces duplicate configuration. Each chart still needs its own field and structure mapping; reusing an API does not mean every component can directly use the same data shape.
3.4. Filters and Data Formats
After testing that the API returns data, configure a filter or the component's mapping logic to organize the response into the array, object, or key-value structure the component requires. Inspect the component's sample before deciding on the output shape. Do not copy a filter function from another chart without checking its requirements.
| API response condition | What to address |
|---|---|
| Business data is nested in an outer response | Locate the actual data list first. Do not use response fields such as status codes as chart data. |
| Numbers are returned as strings | Convert them to numbers as the business requires, preserving valid values such as 0. |
| Trend points arrive in an inconsistent order | Sort by time and use consistent time formats and units. |
| Data is empty or includes abnormal entries | Provide an explicit empty state. Filter or flag abnormal entries instead of filling in fixed dummy values to make metrics appear normal. |
| Multiple series or category comparisons | Align categories, series names, units, and the lengths of all arrays. |
For example, a temperature trend chart needs each timestamp paired with its value. Do not take only the temperature array and discard the corresponding times. Filter logic should only organize data for display; business APIs or the backend should centrally maintain key statistical definitions.
Preview Has Data, but the Published View Does Not
Check the API identity, domain, cross-origin policy, and HTTPS requirements from the target environment. An administrator's editor session does not establish the viewer's access.