

data visual
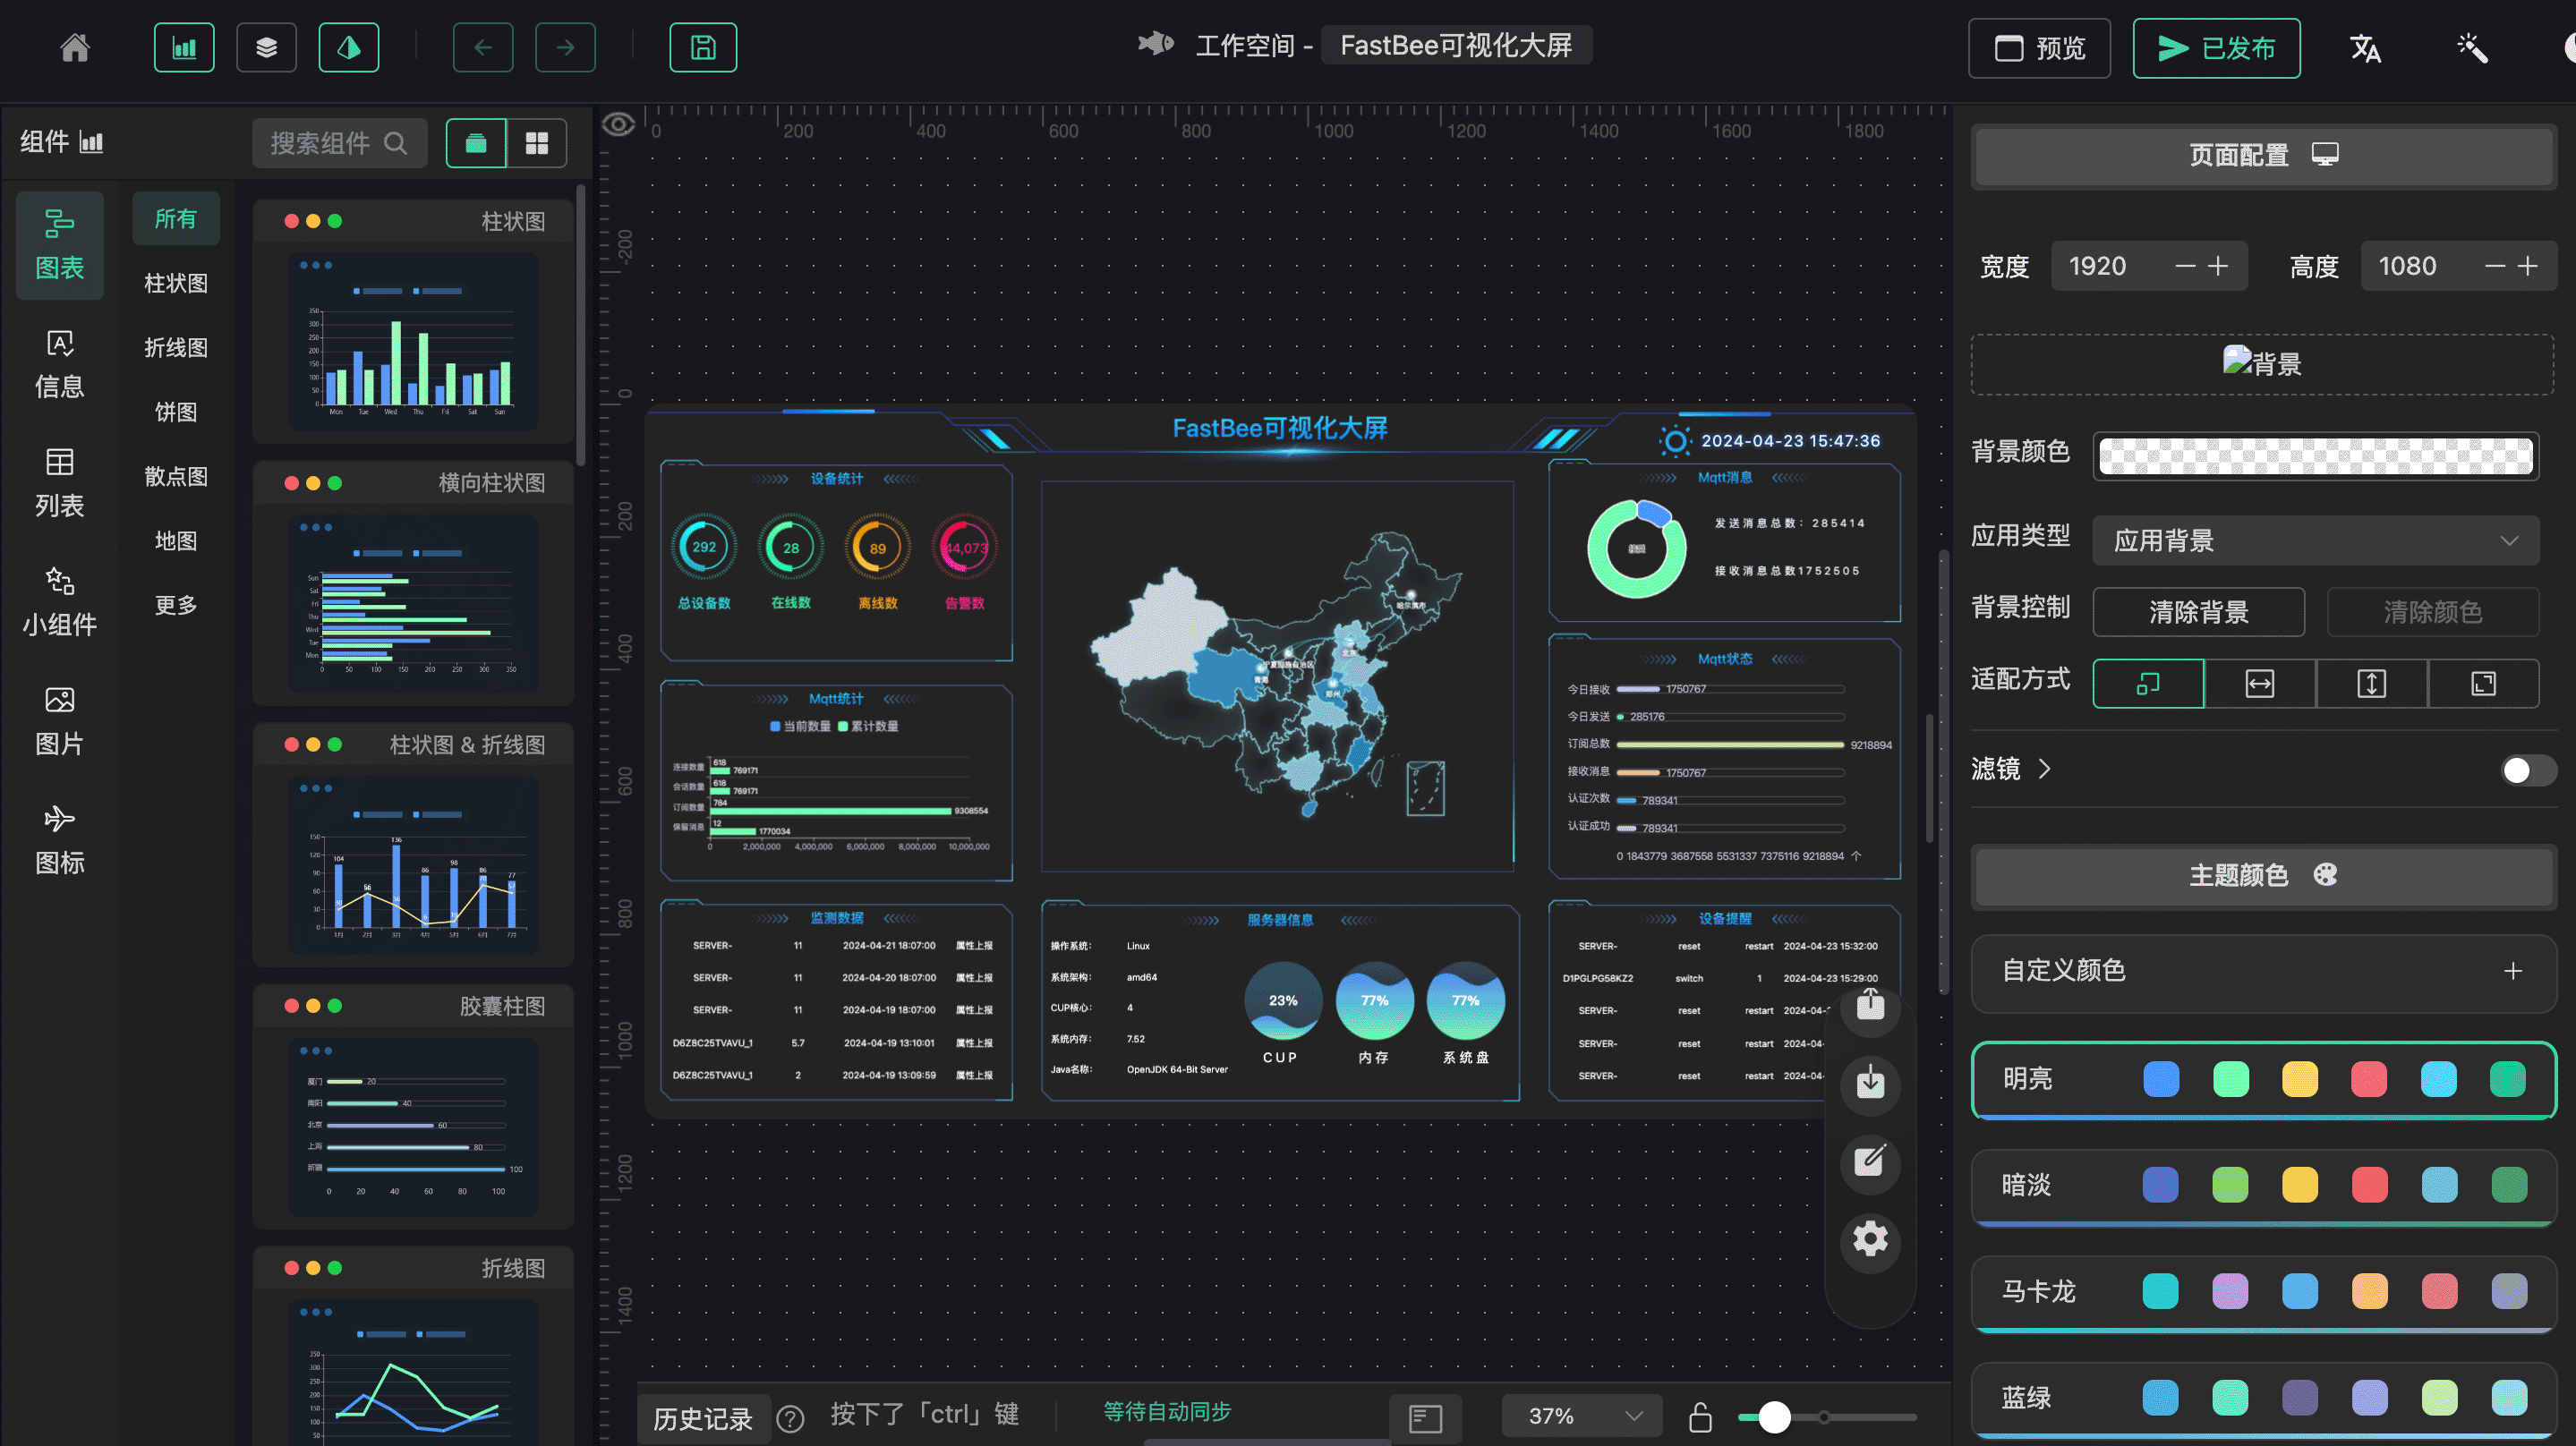
The data visualization service is a data analysis tool that provides secondary-development-ready tooling and a rich set of visualization components. It helps developers quickly turn complex data into visual charts through a graphical interface and interactive operations, helping users understand and analyze data more intuitively, and meeting a range of large-screen visualization scenarios such as smart city, smart park, and smart security.
1. Product Features
Provides rich visualization and industry components, supports custom component integration, includes built-in reference cases for rapid building, supports multiple data sources, and offers zero-code drag-and-drop.
2. Technical Features
- fastbee-view is an efficient, low-code, drag-and-drop visualization platform. Charts and page elements are encapsulated as basic components, so multi-business needs such as conferences and exhibitions, business monitoring, and risk warning can be completed quickly without writing code.
- Technology stack: Vue3 + TypeScript4 + Vite2 + NaiveUI + ECharts5 + Axios + Pinia2 + PlopJS
- Usage flow: create a project --> click the name at the top to edit it --> drag and drop to edit the page freely --> save (auto-save every 60s / manual save) --> preview --> publish (generates an address)